섹션별 상세
mimesis.Generic generates realistic device profiles including UUIDs, locations, and firmware versions. This establishes a consistent identity for the synthetic sensor before creating time series readings.
근거
- Mimesis, pandas, and NumPy enable the creation of realistic synthetic IoT data. — Step-by-Step Guide section
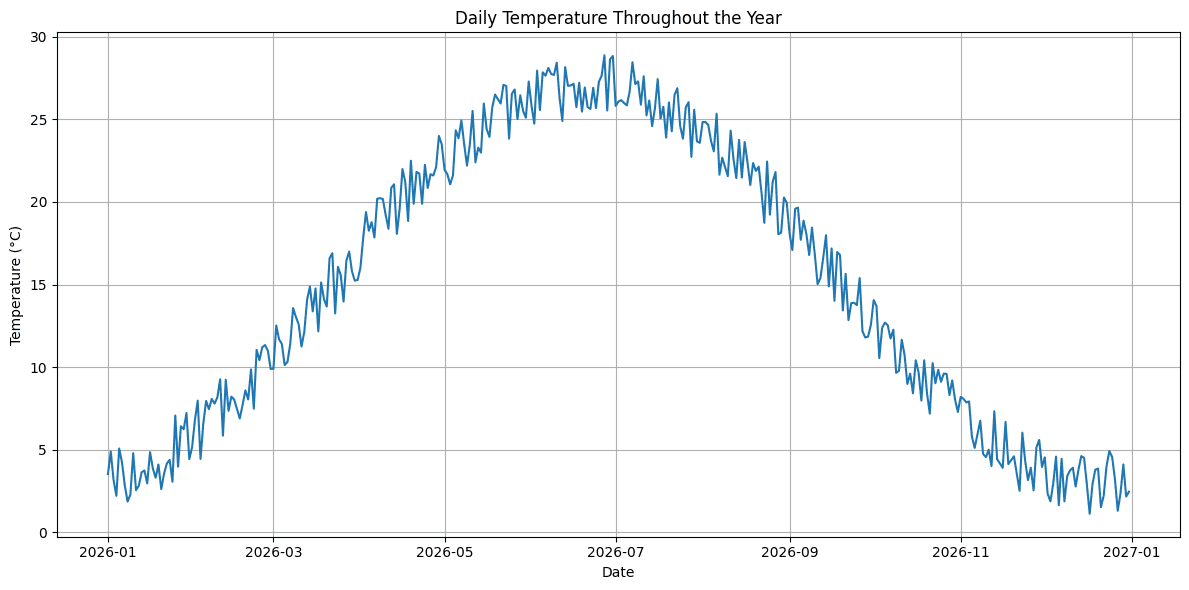
A sine wave equation models the annual temperature cycle, where T(t) = T_base + A * sin(...). This mathematical baseline ensures the generated data mimics natural seasonal fluctuations throughout the year.
The generation loop adds random sensor noise and network latency to the baseline temperature. These additions prevent the data from appearing as a perfect, unrealistic curve and simulate real-world IoT device instability.
The final DataFrame structure allows for immediate integration into forecasting models or visualization tools. Visual verification confirms that the generated data successfully captures the intended seasonal peaks and daily fluctuations.
기술
- Python
- mimesis
- pandas
- NumPy
- Matplotlib
활용 사례
- IoT sensor data simulation
- Forecasting model testing
- Dashboard prototyping
AI 분석 전체 내용 보기
AI 요약 · 북마크 · 개인 피드 설정 — 무료
출처 · 인용 안내
원문 발행 2026. 06. 01.수집 2026. 06. 01.출처 타입 RSS
인용 시 "요약 출처: AI Trends (aitrends.kr)"를 표기하고, 사실 확인은 원문 보기 기준으로 진행해 주세요. 자세한 기준은 운영 정책을 참고해 주세요.